
Last updated: November 2, 2026
You run the reports every month. They balance. The software is connected to the bank and the invoices go out. Somebody reconciles. And yet when you ask a simple question, such as which part of the business actually makes money, or how much you really paid yourself this year, the reports cannot answer it.
That is rarely a software problem. Usually the software is doing exactly what it was told. The problem is the list of accounts underneath it, the chart of accounts, and it was most likely set up by someone who knew the software well but had never closed a month or prepared a return from those books.
What a chart of accounts is supposed to do
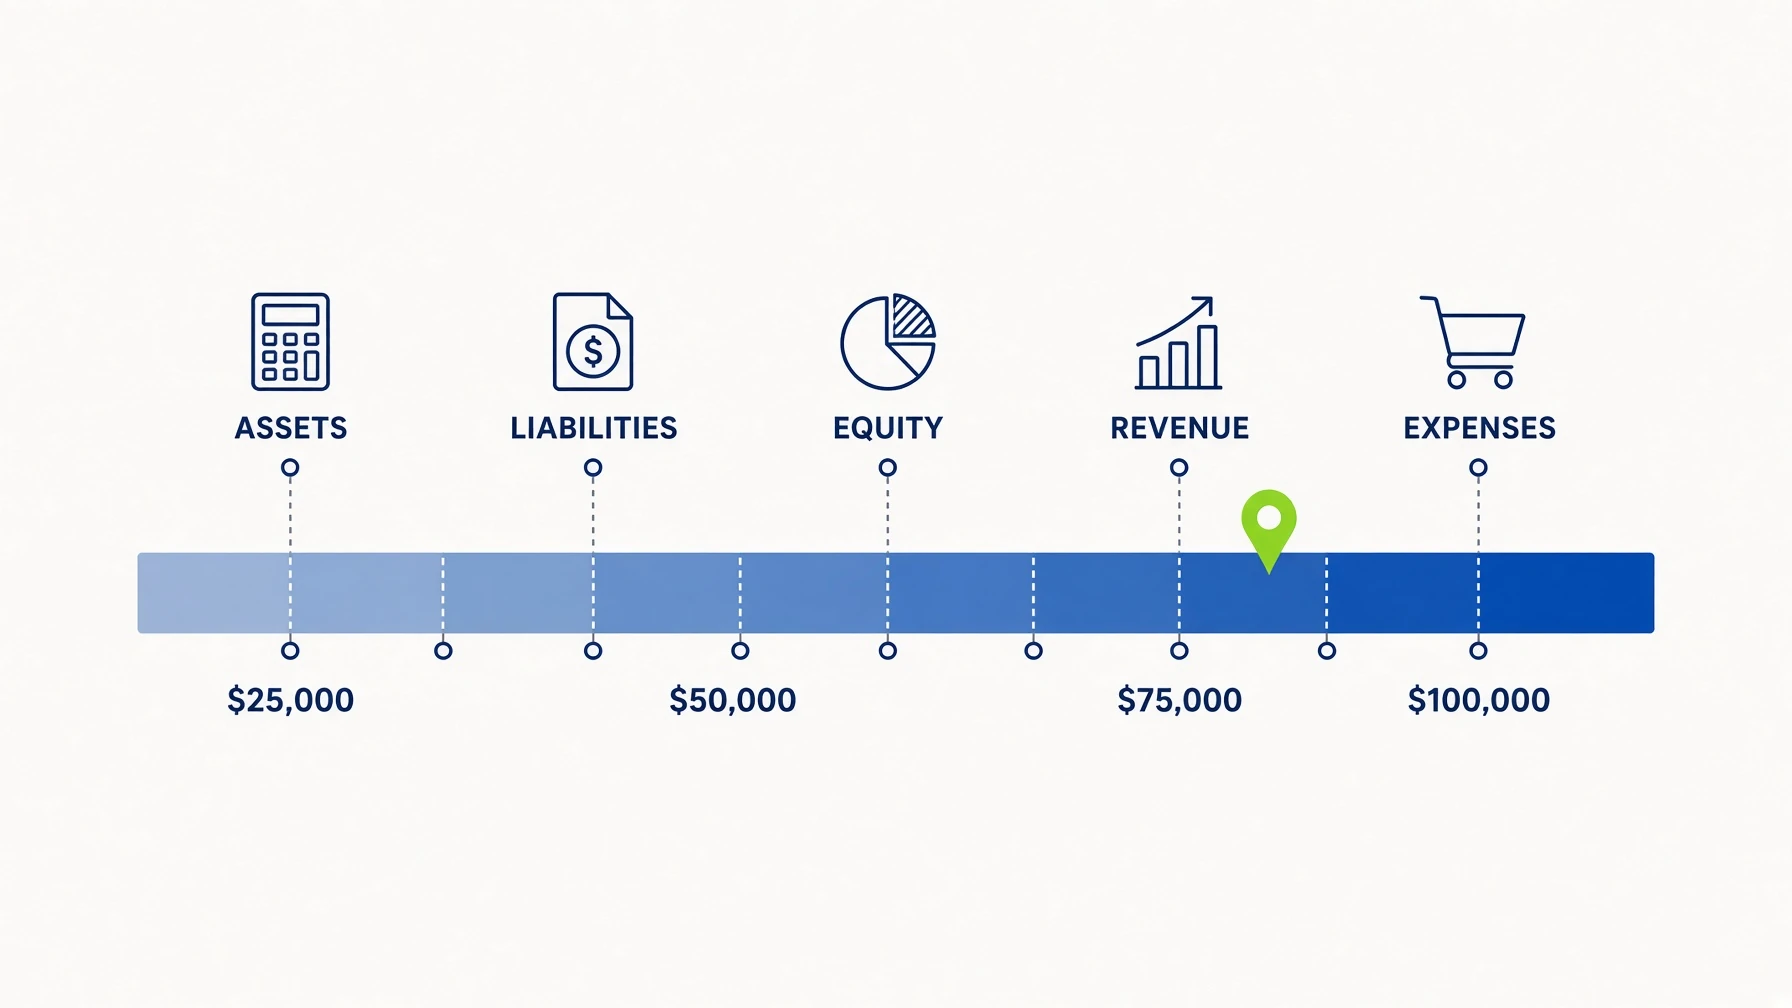
The chart of accounts is the list of every category your business records money into: revenue, costs, expenses, assets, liabilities, and equity. Every transaction lands in one of them. Every report you run is just those accounts, added up and arranged.
So the chart decides what you can see. If all of your revenue goes into one account called Sales, no report will ever tell you which service is profitable. If the owner's pay and the employees' pay share an account, no report will separate them, and the tax return needs them separated.
A good chart serves three readers at once. You get the management view you need to run the business. Your CPA gets the categories the return asks for, without a pile of reclassifications at year-end. And a lender or buyer gets a balance sheet that describes the business the way it actually is. A chart built for only one of those readers usually fails the other two.
Why so many are wrong from day one
Most charts of accounts are not designed. They accumulate.
Accounting software builds a starter chart during setup, often based on an industry picked from a menu. That template is generic by design, and it is rarely edited afterward. From then on, accounts get added whenever a transaction does not seem to fit anywhere, so the chart grows by improvisation: a new account for one vendor, another for a one-time purchase, a third because nobody remembered the first two existed.
The other common origin is an implementation project. A consultant sets up the software and connects the bank feeds, then builds the invoice templates and wires up the integrations. The system works. Implementation consultants are often very good at that part. Whether anyone checked the accounting is a separate question, and it is usually where the trouble starts. The chart reflects how the software is organized, not how the tax return or the financial statements need to read.
Neither origin is anyone's fault. But a chart that grew this way tends to have the same problems: too few accounts where detail matters, too many where it does not, and at least one catch-all that quietly absorbs everything uncertain.
The same business, two charts
Take a hypothetical residential HVAC company in Katy. It is an S corporation with one owner, four technicians, an office manager, and three lines of work: service calls, new system installations, and annual maintenance agreements. Here is how its chart looks as it typically grows, set beside the same chart built on purpose.
| Area | The chart as it grew | The chart built on purpose | What the fix lets you see |
|---|---|---|---|
| Revenue | One account called Sales | Service calls, Installations, Maintenance agreements | Which line of work actually carries the business |
| Direct costs | Supplies, for everything from compressors to printer paper | Cost of goods sold split into Equipment, Parts and materials, Subcontractors, Field labor | Gross margin by type of job |
| Payroll | One Payroll account for every wage | Officer wages, Technician wages, Office wages, Employer payroll taxes | Officer compensation on its own line, as the S corporation return requires |
| Owner money | Owner Payments, sitting in expenses | Shareholder distributions in equity, plus a separate shareholder loan account | Profit that is no longer understated, and distributions measurable against salary |
| Vehicles | Truck Expenses, including the full loan payment | Fuel, Repairs, Insurance, with the vehicle loan as a liability and interest as its own expense | A loan balance that matches the lender, and only the interest deducted |
| Taxes | One Taxes account mixing employer payroll tax and the owner's personal estimated payments | Employer payroll taxes as an expense; the owner's personal payments treated as distributions | Personal tax payments that stop inflating business expenses |
| Catch-alls | Miscellaneous and Ask My Accountant, both growing | None, or one holding account cleared every month | Every dollar landing somewhere the return can use it |
The first chart is not unusual. It balances and reconciles, and a P&L comes out every month. That P&L will not explain margins, though, and at tax time most of it has to be pulled apart and put back together. The second chart is not much longer. It is just organized around the questions the owner and the return actually ask. If you want to see how those categories read once they are in place, our guide to reading a profit and loss statement walks through it.
Owner draws vs. salary: the most common single error
If one mistake shows up in more small business charts than any other, it is how the owner gets paid. The right structure depends entirely on the entity, and a chart set up without knowing the entity usually gets it wrong.
| Entity | How the owner is paid | Where it belongs in the books | The common mistake |
|---|---|---|---|
| Sole proprietor or single-member LLC | Draws | Equity, in an owner's draw account | Draws booked as an expense or as wages |
| Partnership or multi-member LLC | Guaranteed payments, draws, or both | Guaranteed payments as their own expense line; draws in each partner's equity | Partners run through payroll as employees, or one combined draw account for all partners |
| S corporation | Salary through payroll, plus distributions | Officer wages as an expense; distributions in equity | Distributions with no salary at all, or salary recorded as a distribution |
| C corporation | Salary through payroll, and dividends | Officer wages as an expense; dividends against retained earnings | Owner's personal spending run through business expense accounts |
The tax stakes differ by row. For a sole proprietor, a draw recorded as an expense understates profit, and with it the income and self-employment tax the return should show. For an S corporation, the split between salary and distributions is itself a tax position, because salary carries payroll tax and distributions do not. If the books cannot show the two separately, nobody can tell whether the salary is reasonable. Our post on reasonable salary for an S-corp owner covers how that number gets set.
The shareholder loan account deserves a mention too. When an owner puts money in or takes money out, the books need to say whether it was a loan, a contribution, or a distribution. Those are three different accounts with three different consequences, and treating them as interchangeable is how a balance sheet stops making sense.
Signs your chart is working against you
You do not need to read the whole chart to know whether it has problems. The symptoms show up in ordinary use.
Your CPA sends a long list of reclassification questions every year, and many of them are the same questions as last year. A catch-all account like Miscellaneous or Uncategorized carries a meaningful balance. The P&L shows one revenue line for a business that sells several different things. Profit swings from month to month in a way that does not match how the business actually felt. The balance sheet shows a loan that the lender says is much smaller. Or the chart has accounts nobody can explain, often with a single transaction each, alongside accounts that hold far too much.
Any one of these is common. Several together usually means the chart was never built around how the business works or how the return is prepared. If the books have also fallen behind or picked up errors along the way, our bookkeeping cleanup checklist covers what to look for in the transactions themselves.
Fixing it without breaking your history
A chart of accounts can be restructured, but it is not a casual edit. The decisions come before anyone touches the software.
The first is timing. Restructuring at the start of a fiscal year keeps one year on one structure, which makes comparisons cleaner. Restructuring mid-year means deciding whether to reclassify the months already recorded, and for a year that will be filed on that data, the answer matters. The second is history. Renaming an account, merging two accounts, and creating a new one look similar in the software but treat past transactions very differently, and some of those changes cannot be undone. The third is everything connected to the chart: bank rules, payroll mappings, integrations, and saved reports often point at specific accounts and break quietly when those accounts change.
Opening balances also still have to agree with last year's filed return. A restructure that loses that connection creates a new problem while solving an old one. The accounting method matters as well, since a chart built for accrual reporting carries receivable and payable accounts a cash-basis business may handle differently; our cash vs. accrual guide explains the difference.
This is why we treat the chart as part of the bookkeeping engagement rather than a setup task. If you come to us for tax preparation only, we work from the books you have and say plainly where the structure limits the return. If you want planning and a year-round relationship, the books are part of that engagement, and so is the chart they sit on. It is built to the same standards the return is prepared with, so the categories you see during the year are the ones the return uses at the end of it.
Not sure your chart is built right?
We can review your chart of accounts against how your business runs and how your return is prepared, then map out a restructure that keeps your history intact.
The Bottom Line
A chart of accounts decides what your reports can tell you, and most small business charts were never designed to answer the questions owners and tax returns actually ask. They start from a generic template or a software implementation and grow by improvisation. The result usually balances. It still hides margins and mixes owner pay with employee pay, while catch-all accounts quietly do work that belongs elsewhere. The single most common error is how the owner gets paid, and the right structure depends on whether the business is a sole proprietorship, a partnership, an S corporation, or a C corporation. Fixing a chart is worth doing, as long as the timing and the history are decided first and nothing connected to it breaks along the way. Get it right once, and the reports start answering the questions you were already asking.